


Importance of Lazy Loader in Website Optimization
5th November 2020
AGILE VS WATERFALL: WHICH SOFTWARE METHODOLOGY IS RIGHT?
23rd November 2020
Introduction to Seaborn
Seaborn is one of the world’s most regarded Python libraries that is purpose-built to create beautiful looking visualizations. It can be considered as an extension of another library called Matplotlib as it is built on top of that.
Data visualization is easily performed in Seaborn, and this is how the workflow looks like:
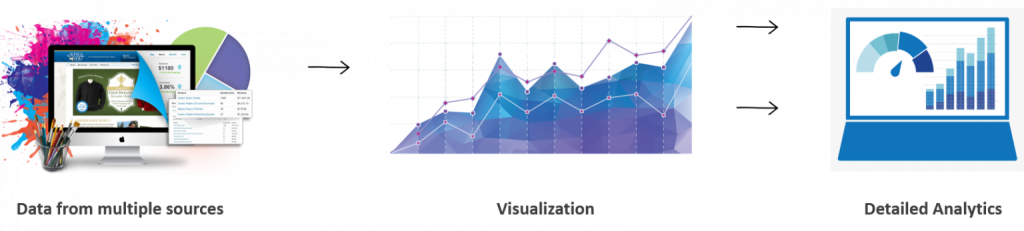
Data from various sources:
The data that is needed to perform visualizations and analytics can come into the architecture from a variety of sources, such as a local storage unit, server, cloud structure, etc.
Data visualization:
This is where the data is transformed from its number-state into an aesthetically pleasing visual counterpart. Seaborn plays the main role here.
Data Analytics :
The result of data visualization is to take a look at the data in a way you have not done before. Analysis helps doing just this to reveal insights and trends that could not have been spotted otherwise.
This workflow is very important as it is the chain of events that helps in driving a variety of businesses and their requirements to their goals.
The Seaborn library is no doubt popular, but I am sure that you are wondering about why people make use of Python for this.
Python for Data Visualization
Python has been one of the top programming languages of the previous decade, and it has been forecasted to be on the top in the next few years as well. I am sure that you have already heard of Python in one way or another.
What makes Python so popular for data visualization? Well, it provides numerous advantages over many other programming languages out there, especially for data extraction and analytics.
Python: Easy to Use :
Python is purpose-built, offering easy development and convenience. This means that it provides a high-level syntax, which is easily understood. Also, it is highly readable without requiring to go through complex training to understand the basic code.
Python: A Powerful Programming Language :
Python has been put to use in many of the fields today. Even though the language itself is simple in its working, it definitely packs a big punch. It is actively being used to solve the world’s most complex problems in the fields of medicine, Artificial Intelligence, and computing in general.
Python: Big Developer User Base :
Another advantage with Python is that it has millions of developers across the globe working on it and its libraries. This allows for a large community to work hand in hand to put the language to good use.
Python: Superiority in Data Science :
Data visualization is a key part of Data Science and Data Analytics. Python has been the go-to tool for anything related to data processing as it has a plethora of libraries and tools that allow for easy handling and processing of large amounts of data.
Features of Seaborn
Before we talk about the features of Seaborn, it is important to know one thing: Since Seaborn is an extension of Matplotlib, it is meant to complement the latter rather than replacing it completely.
With this said, here are the top features of Seaborn:
- Lots of themes to work with Matplotlib-style graphics
- Ability to visualize both univariate and multivariate data
- Support for visualizing varieties of regression model data
- Easy plotting of statistical data for time-series analytics
- Seamless performance with Pandas, NumPy, and other Python libraries

