GOOGLE LAUNCHED GOOGLE PLAY SECURITY REWARD PROGRAM FOR ANDROID SECURITY
15th December 2020
Amazon CloudFront
21st December 2020
The modern push notification can include media, action buttons, and can be tailored to individual users. They can be used to convey information and updates, encourage users to engage with an app, send reminders, serve as a step in the user journey, and much more. They also extend beyond mobile devices, to web push notifications on laptops and desktop computers.
In on the ongoing battle to keep users engaged in a high competition, high-stakes marketplace, push notifications can play a key role. They can also, however, be problematic if used thoughtlessly. Indeed, too many pushes can even cause users to uninstall an app entirely.
Learn more about push notifications below, with statistics on who sends them, the best times to send them, what sorts of pushes users like to receive, and how to increase engagement and CTR.
Key push notification statistics
- Average US smartphone user receives 46 app push notifications per day
- 40% of web push notification senders belong to either the ecommerce or media, publishing & blogging sectors
- Opt-in rates are much higher on Android devices (91.1%) than iOS (43.9%); users for the latter have to actively opt-in, while the former are automatically enrolled, say Accengage
- Localytics peg overall opt-in rate at 53.3%
- 7% push reaction rate on Android devices; 4.9% on iOS (Accengage)
- CleverTap find CTR of 4.1% on Android, and 1.7% on iOS
- Highest push reaction rate of 8.4% occurs on Tuesday
- Emojis (20%), rich formats (25%), tailored send times (40%), advanced targeting (threefold), and personalisation (fourfold) can all improve reaction rates (Accengage)
- CleverTap stats show basic personalisation can improve open rates by 9%, as can emojis (4.94% CTR compared to 3.01%)
- Localytics find app retention rate (11+ sessions) stand at 39% if push notifications are targeted, compared to 21% for broadcast messages
- Only 8% of marketers use rich push notifications, one source claims
- VWO Engage find that 38% of push notifications are rich format
- 85% of push notifications were segmented in 2017; up from 65% in 2015
- One weekly push notification per week can lead to 10% of users disabling notifications, and 6% to disable the apps
- 31% of users do not like to find push notifications helpful at all; only 18% always find them useful
Push notifications opt-in rates
According to Accengage’s 2018 Push Notification Benchmark, opt-in rates for app push notifications are far higher on Android (91.1%) than iOS devices (43.9%). This is explained by the fact that iOS users must actively consent to push notifications, whereas Android automatically enables push notifications. Average opt-in rate across the two biggest mobile operating systems stands at 67.5%. (To see the kind of things that might make people turn off push notifications, see the ‘What makes users disable push notifications?’ section below).
It should be noted that the mean average here gives the two operating systems equal weighting. This does not necessarily represent the balance we find in the market. As of Q2 2018, Android devices accounted for 88% of new device sales, compared to iOS’s share of 12%. This 50/50 balance is used throughout the report when an ‘average’ push notification statistic is given.
The study analysed 50 billion push notifications sent to 900 million users over H1 2018 over Accengage’s own platform (so not necessarily perfectly reflective of the general market, though certainly an instructive insight into it).
Accengage’s push notification statistics are broken down to analyse how behaviour pertaining to app push notifications differs in various contexts.
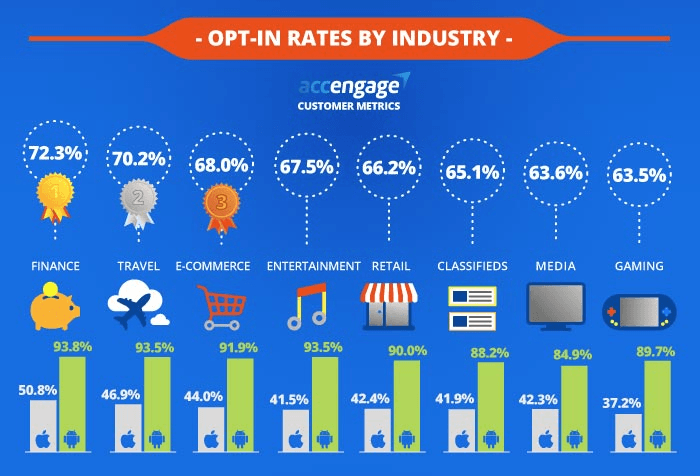
Breaking the opt-in data down by industry, Accengage found that finance was the subject around which users were most likely to enable to push notifications. This was followed by travel and ecommerce.
If we just looked at Android devices, entertainment would creep ahead of ecommerce. There is a greater disparity between top and bottom on iOS devices, in both proportional and absolute terms – perhaps giving a stronger indication of push notification content that users are interested in they actively enable push notifications.
On the other hand, the plateau we see in Android devices suggests that if an opt-out rather than an opt-in system is used, users are less choosy about the industry genre of push notifications they receive.
Push notification opt-in rates by industry
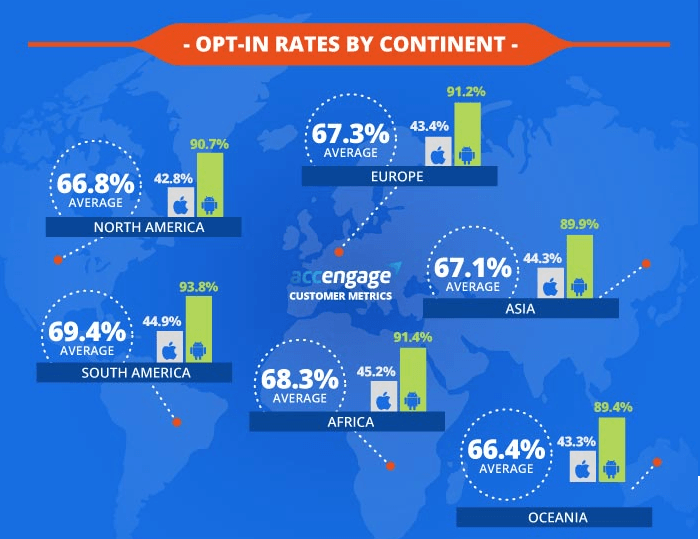
Push notification opt-in rates do not seem to vary a great deal between continents, Accengage’s push notification statistics seem to indicate. The highest iOS push notification opt-in rates are reported in Africa, at 45.2%, 2.4% greater than the lowest figure of 42.8% in North America.
For Android devices, South America reports the highest push notification opt-in rates of 93.8%, while Oceania reports the lowest, at 89.4% – a difference of 4.4%.
In short, it seems that the push notification is a global phenomenon, with no region seeming to like or dislike them much more than any other.
Push notification opt-in rates by continent
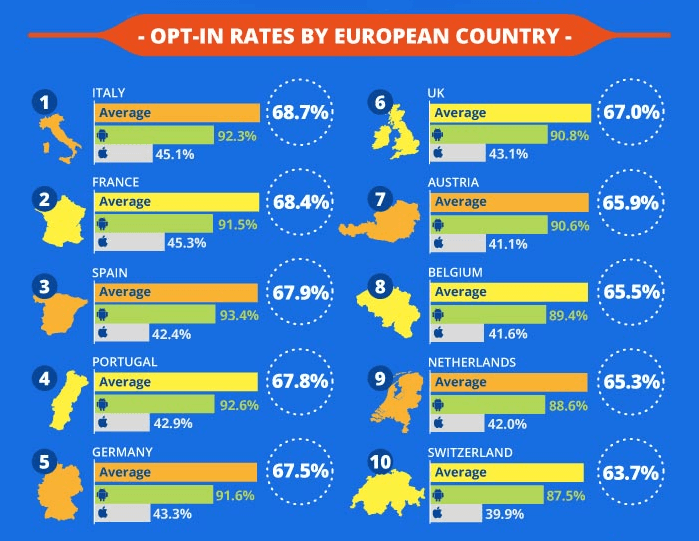
Focusing on Western Europe (Accengage is France-based), the highest app push notification opt-in rates are found in Spain on Android devices at 93.4%, and in France on iOS at 45.3%. According to Accengage’s ‘average’, Italy tops the list. Again, we do not see a great deal of divergence between countries.
Push notification opt-in rates in European countries
Push frequency vs. unsubscribe rate by industry
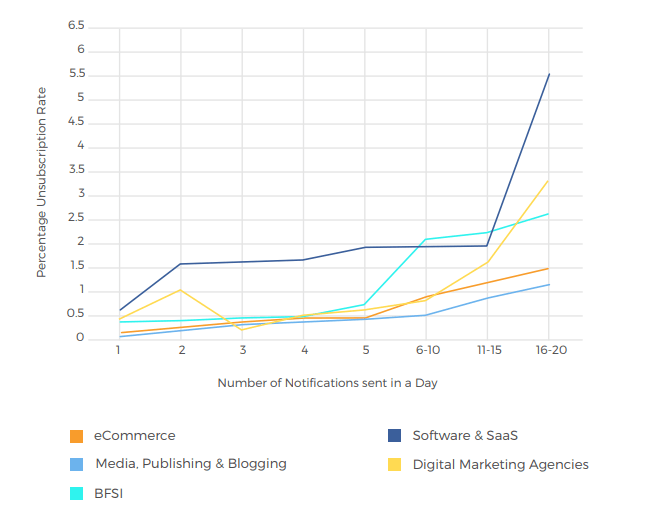
Across industries, unsubscribes remain below 1% up to the five pushes per day mark in this analysis. The sharpest increase lies between 11-15 per day (a touch under 3%) and 16-20 (7%). Certainly marketers should think carefully before sending in excess of 15 push messages per day.
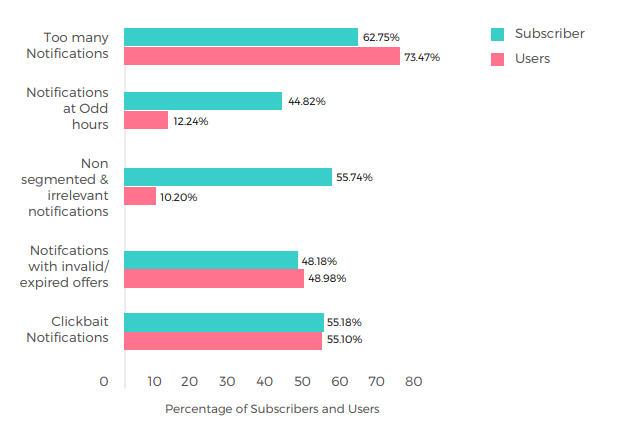
Send too many, and it runs the risk of crossing the line into spam. This is about more than the frequency of sending. It seems senders and recipients (‘subscribers’ are recipients, while ‘users’ are senders of push notifications in the below chart) differ in their interpretation of what qualifies as spam.
What makes push notifications classify as spam?