
What is Reinforcement Learning?
11th January 2020
What is PyCharm?
15th January 2020
Tableau software is one of the fastest growing data visualization tools which is currently being used in the BI industry. It is the best way to change or transform the raw set of data into an easily understandable format with zero technical skills and coding knowledge.
What is Tableau used for?
Usage of Tableau software are listed below:
- Tableau software is used to translate queries into visualization.
- It is also used for managing metadata.
- Tableau software imports data of all sizes and ranges.
- For a non-technical user, Tableau is a life saver as it offers the facility to create ‘no-code’ data queries.
Why Tableau?
Why use Tableau software when there are a whole lot of tools available to perform data visualization?
Tableau is greatly used because data can be analyzed very quickly with it. Also, visualizations are generated as dashboards and worksheets. Tableau allows one to create dashboards that provide actionable insights and drives the business forward. Tableau products always operate in virtualized environments when they are configured with the proper underlying operating system and hardware. Tableau is used to explore data with limitless visual analytics.

A few features of Tableau are given below:
- Real-time analysis
- Data blending
- Collaboration of data
- Allowing to work on without technical knowledge
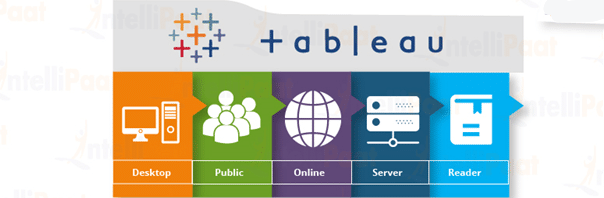
Tableau Product Suite
Tableau Product Suite includes Tableau Server, Tableau Desktop, Tableau Reader, and so on. Let’s understand what exactly is meant by these terms in the following sections:
- What is Tableau Server?
- What is Tableau Desktop?
- What is Tableau Reader?
- Tableau Online
- Tableau Public
What is Tableau Desktop?
This product allows one to code and modify the reports. Starting from creating reports and charts to combining them to form a dashboard, all this work is done in Tableau Desktop.
Tableau Desktop is classified into the following according to connectivity and data sources:
- Tableau Desktop Personal
The development features of Tableau Desktop Personal version are close enough to that of the Tableau Desktop. In this particular version, the workbook is in the private mode and the access is limited. That means, these workbooks can’t be posted and are for personal use only. Therefore, they have to be divided either on Tableau Public or Offline.
- Tableau Desktop Professional
This version is very much alike to Tableau Desktop, only that the work generated or created in Tableau Desktop is published on the Tableau Server. In this version, there would be full access to all sorts of data types. It is great for people who wish to publish their work on the Tableau Server.
Want to grab a detailed knowledge on Tableau? Check this Tableau Training in Singapore!
What is Tableau Reader?
It is a tool that allows one to view visualizations and workbooks generated using Tableau Public or Tableau Desktop. This data can easily be filtered, yet modifications are limited. Since anyone getting the workbook can view it using Tableau Reader, there is no security.
What is Tableau Server?
This is mainly used to share visualizations and workbooks which get generated in the Tableau Desktop application throughout the organization. The work will become accessible once it is uploaded on the respective servers.
To increase sharing of dashboards in Tableau Server, you should publish your work beforehand in Tableau Desktop. Though, it’s not completely mandatory for the licensed users to have an installed Tableau Server. They just need the login credentials using which they can verify these reports.
As the security of Tableau Server is high, it is convenient for fast and effective data sharing in the organization. If you have any doubts or Queries related to Tableau, get it clarifies from BI Experts on BI Community.
Tableau Online
As the term ‘online’ suggests, Tableau Online is a sharing tool. It has a similar usage as Tableau Server, but the data is saved on servers which are provided in the cloud maintained by the Tableau group.
The data that can be published on Tableau Online has no storage limit. Tableau Online and Server, both need workbooks which are created by Tableau Desktop to broadcast the data. Data streamed from web applications, be it Salesforce or Google Analytics, are supported by both, Tableau Online and Tableau Server.
Tableau Public
Tableau Public is especially built for money-saving users. As the word ‘public’ suggests, the created workbooks can’t be locally saved, rather it is sent to Tableau’s public cloud which can be accessed by the general public. This is an economical version which is very good for people wanting to learn and share their data with people.
Advantages of Using Tableau
- Fantastic Visualizations
You can now work with a lot of data that doesn’t have any order to it and create a range of visualizations. Well, thanks to the in-built features of Tableau which help you create visualizations that surely stand out of the crowd. You also have the option of switching between different visualizations to bring about a greater context, ways of drilling down data, and exploring the data at a minute level.
- In-depth Insights
Tableau can help enterprises futuristically to analyze data without any specific goals in mind. You can explore visualizations and have a look at the same data from different angles. You can frame ‘what if’ queries and work with data by hypothetically visualizing it in a different manner and dynamically adding components for comparison and analysis. When you are working with real-time data, then these capabilities are highlighted in a huge manner.
- User-friendly Approach
This is the greatest strength of Tableau. It is built from the ground level for people who don’t have any technical skills or coding experience. So, everything can be done with this tool by anybody without any prior set of skills. Since most of the features are in a drag-and-drop format, each visualization is so intuitive and self-depicting.
- Working with Disparate Data Sources
Tableau has a powerful reason to be included by various organizations in today’s data-driven world where data can come from any point and any disparate sources. Tableau has an edge over other Business Intelligence and Analytics tools as it lets you work by connecting to various data sources, data warehouses, and files which exist in the cloud, big data that exists in spreadsheets, and non-relational data, among other types of data. Tableau effortlessly blends all different types of data to help organizations come up with compelling visualizations.
- Adding Datasets
Be it a database or an Excel workbook, with Tableau one can easily add new datasets which get automatically blended with Tableau using common fields.
- Switching Between Visualizations
You also have the option of switching between different visualizations to bring about a greater context, with ways of drilling down data and exploring it at a minute level.
Tableau is one of the top Business Intelligence and Data Visualization tools available today. It is being used by most of the Fortune Global 500 list of companies in order to derive valuable insights from their data.