
Build an API With Fastify and MongoDB
16th July 2021
Understanding Different Types of React Components
19th July 2021
User experience is an important part of generating conversions and making sales. Even the smallest of kinks in your UX armour could cost you repeat visitors and revenue, whereas big ones could lead you to lose out to your competitors.
Looking for these issues and identifying new opportunities can be complicated, time-consuming, and expensive to do, with lots of testing and research needed along the way. However, this is where Google Analytics enters the fray to provide intuitive insights into how to improve your UX design.
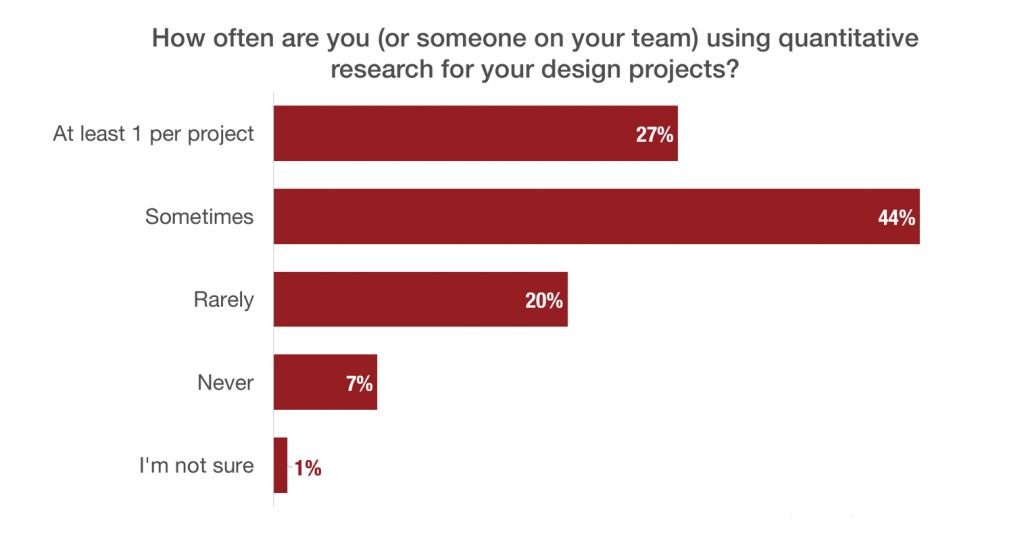
The importance of conducting healthy levels of quantitative research is apparent to 27% of businesses. However, a further 27% rarely or never conduct research ahead of their UX design projects. This presents an opportunity for companies to outmanoeuvre their competitors with more fine-tuned user experience models.
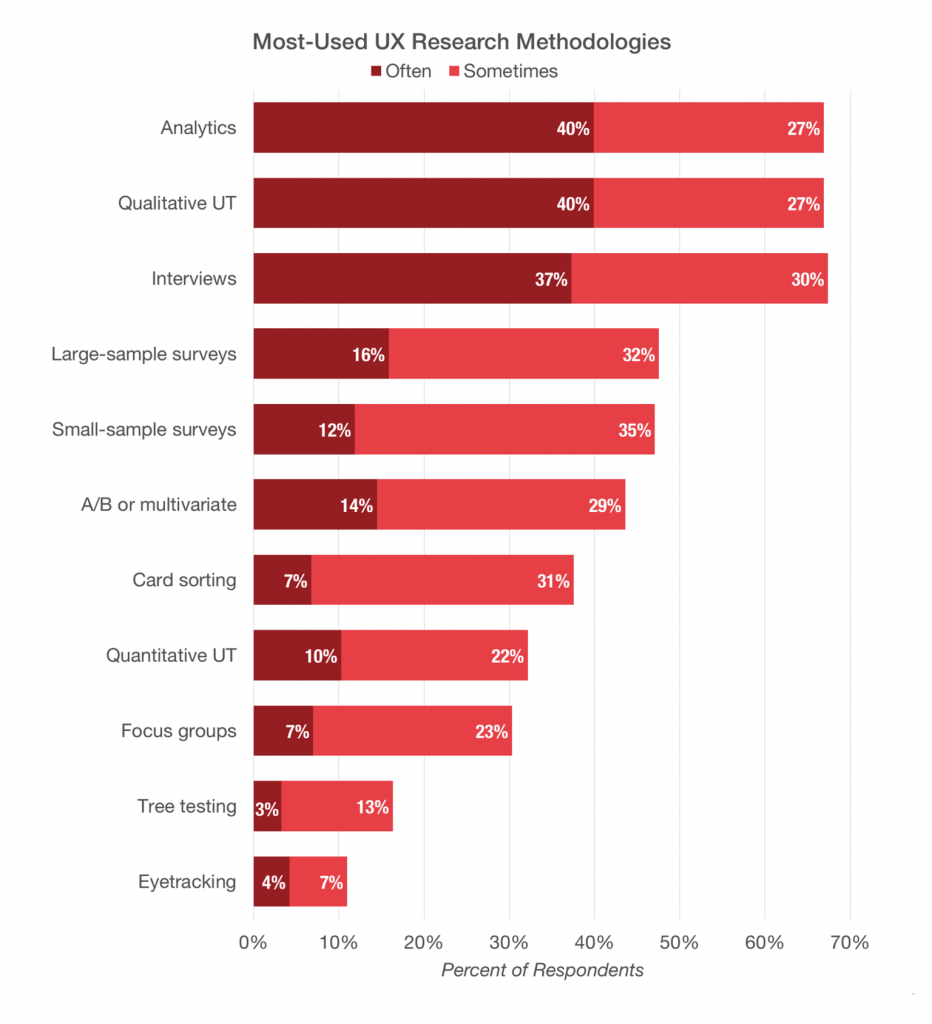
When it comes to UX research methodologies, analytics engines are heavily relied upon by businesses, with 67% using the method to cater more strategically to customers.
With its first-hand data sets and intelligent insights, Google Analytics has become widely favoured by businesses, and although there are plenty of premium features built into the platform, a strong level of UX research can be conducted using the free version of Analytics.
Let’s take a deeper look into how the insights offered by Google Analytics can be used to improve the UX design of online businesses:
How Google Analytics Can Help With UX
User experience and conversions are heavily intertwined concepts. Successful businesses understand that even the best digital marketing campaigns will struggle to win over leads and hit their targets if their website UX model is lacking in performance.
Business owners and marketers need to take a moment to ask themselves some simple questions before running a marketing campaign:
- How usable is our website?
- Can visitors easily navigate through our pages?
- Does our website make it easy for visitors to get in touch with us?
- Is the website effective in communicating how our brand helps customers?
Keeping track of specific key metrics can help UX designers to learn from the behaviour of a user from the first moment they land on a page right up to the point where they convert by signing up to a service or buying a product.
Although there are no one-size-fits-all metrics to analyse your UX design, Google Analytics is excellent at providing insights into how a website is performing and can help users to optimize their pages with better UX for sales and conversions.
There are two key areas that you’ll need to focus on when it comes to improving UX design. Firstly, user behaviour enables businesses what people are actually doing when on their website. This information can help to reveal potential problem areas which can be prioritised and tweaked to ensure a better experience for traffic arriving on-site.
Secondly, behavioural flow can help to chart a user’s journey from the moment they arrive on-site right up to the moment they exit. This form of insight is ideal if you’re having trouble visualising information.

With the help of Google Analytics behaviour reports, it’s possible to identify pages that achieve the highest volume of traffic and the paths that they typically take. However, it can also help to indicate other paths that could be better optimised.
The Power of Audience Insights
The Audience insights offered by Google Analytics can be the perfect tool for UX professionals. It provides a comprehensive breakdown of who your users are, offering vital insights surrounding demographics, interests, location, devices used, engagement times and frequency or recency of each user.

Some notable actions that a UX professional can take based on the available Audience data from Google Analytics include:
- Developing on-site translation options if a large volume of audience members arrive from a non-English speaking nation.
- If more users are accessing the website at night, it could be worth implementing a dark/night time variation of the site or app.
- The devices data can help you to experiment with device-specific content and layout changes as well as creating ads for specific devices. For instance, if you’re noticing more visitors arriving through Mobile, it could be worth developing mobile-specific content, and even optimise the layout to fit smaller screens.
- Demographic data about age and gender can also offer insights into experimenting with content displayed on-site.
Monitoring Bounce Rates
Bounce rates directly refer to the percentage of visitors who have entered your site and exited without clicking through somewhere else. Both high and low bounce rates can mean different things. For instance, a high bounce rate could tell marketers that there’s a broken opt-in or badly targeted offer. If your opt-in form isn’t working then it’s no surprise that the bounce rate is high – but fortunately, this is an issue that can easily be fixed.
Overall, bounce rates are a strong indicator of a landing page’s performance, especially when it comes to PPC campaigns.
It’s worth noting that high bounce rates aren’t necessarily a bad thing, especially if you’re also experiencing high conversion rates. Analytical data can display data relating to all of your traffic, which means it will also show bouncebacks from visitors who aren’t part of your target audience – which can be a good thing because it shows the page qualifies your leads efficiently.
But, let’s say you’re running an online store, and your bounce rates are in the clouds. What does this mean for you? Well, people aren’t navigating your store, and they exit right after ending up on your site. Here are some explanations for the issue:
- a campaign targeting issue (you are not targetting the right audience with your messaging),
- bad website design,
- technical glitches,
- product pages that are not optimized for conversions,
- not a great offer of products.

Source: https://cxl.com/guides/bounce-rate/benchmarks/
When it comes to service-based landing pages, it can save money in the long run because you can then focus on further converting or serving qualified leads instead of wasting time vetting or dealing with unqualified leads.
Depending on the goals of your website and webpages, a high bounce rate could indicate that people in fact quickly found the information they were looking for, but the page failed to keep them interested in wanting more or converting.
This can be particularly true for blogs or informational sites. Visitors would have received the information that they were looking for but the page was a dead-end that’s lacking a CTA, no opt-in form or links to more content. In this case, it’s important to modify the page to capture more leads through links to relevant blog posts, offers, or sign-ups.
Gain Insights Into How Long Visitors Spend on Your Pages
By default, after installing the Google Analytics pageview tag, users can access a metric called Avg. Session Duration. This is generally understood to equate to the amount of time that a visitor spends on each visit to your website.
Despite its popularity, this metric can be inaccurate at times. Google Analytics only measures Avg. Session Duration based on timestamps of the data that it receives – which may go some way in explaining why most bounces – or visits on the website with one pageview or event documented – will have an Avg. Session Duration of 00:00:00.
However, it’s possible to get around this limitation by firing timing hits. These can help to calculate the time users spend on-site more accurately without recording another pageview or event. To do this, you simply need to send the timing hits by implementing the following code to fire at specific intervals on your website:
So how would you get around this limitation? By firing timing hits. These can help accurately calculate the amount of time a user spends on a page without recording another pageview or event. You just need to send the timing hits by implementing this code to fire at specific intervals on your site:

Once it’s implemented, the hits will be visible in the Behaviour > Site Speed > User Timings section within Google Analytics.
It’s important to differentiate between the session times of genuine traffic and bad traffic. Platforms like Finteza can help you determine that. The tool identifies the quality of incoming traffic and gives it a specific category (e.g. “Bot traffic”, “Clean Traffic”, “Cookie Manipulation”, “Spam”, and many more). Recently, Google Analytics has been registering sessions with a landing page of “/trafficbot.life” in traffic reports. That’s spammy traffic.

In UX design, this consideration is important to take into account because it stops businesses from changing strategy based on the flow of bot traffic that won’t influence the business’ bottom line.