

What Is Geo-Restriction?
11 August 2026
How to Send 1 Million Notifications Without Taking Down Your App
2 September 2026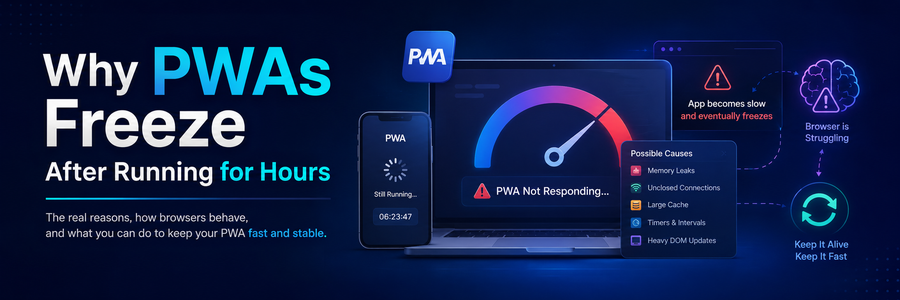
Why PWAs Freeze After Running for Hours
Progressive Web Apps (PWAs) have changed the way web applications behave. With features such as offline support, service workers, caching, push notifications, background synchronization, IndexedDB, and installable experiences, a web application can feel almost identical to a native desktop or mobile application.
But this app-like behavior introduces a problem that developers often discover only after deployment:
The PWA works perfectly at first, but after running for several hours, it becomes slow, laggy, unresponsive, or completely freezes.
The strange part is that refreshing the application often fixes everything immediately.
So, what is actually happening?
In most cases, the PWA itself isn’t the problem. The real issue is that resources inside the application are continuously accumulating or becoming inefficient during a long-running session. Memory leaks, uncontrolled timers, duplicate WebSocket connections, large DOM trees, excessive React renders, growing IndexedDB data, cache problems, and background browser behavior can all contribute to the problem.
Let’s understand why this happens and, more importantly, how to prevent it.
What Does a PWA Freeze Actually Mean?
A frozen PWA doesn’t always mean that the browser has crashed.
You might experience symptoms such as:
- Buttons stop responding.
- Input fields become delayed.
- Scrolling becomes very slow.
- Animations start stuttering.
- API requests appear to stop.
- WebSocket messages are delayed.
- The UI displays outdated information.
- CPU usage increases.
- Memory consumption continuously grows.
- The entire application becomes unresponsive.
- Refreshing the page temporarily fixes the problem.
For example, imagine a chat PWA that a user opens at 9 AM and keeps running throughout the workday.
At 9 AM:
Everything is fast.
At 12 PM:
Everything still works normally.
At 3 PM:
Some interactions start feeling slower.
At 5 PM:
Messages may be delayed and scrolling becomes less responsive.
At 6 PM:
The application freezes.
The user refreshes the page, and suddenly everything is fast again.
This behavior is a strong indication that something accumulated during the session.
1. JavaScript Memory Leaks
One of the most common causes of long-running application performance problems is a JavaScript memory leak.
JavaScript has automatic garbage collection. When an object is no longer reachable, the browser can eventually remove it from memory.
However, an object cannot be garbage-collected if something is still referencing it.
This can happen accidentally.
For example, consider an event listener:
useEffect(() => {
  window.addEventListener("resize", handleResize);
}, []);
If the component is repeatedly mounted and the listener isn’t properly removed, old references may remain.
A better implementation is:
useEffect(() => {
  window.addEventListener("resize", handleResize);

  return () => {
    window.removeEventListener("resize", handleResize);
  };
}, []);
The cleanup function is extremely important in long-running applications.
Memory leaks can happen with:
- Event listeners
- WebSocket handlers
- Timers
- Subscriptions
- DOM references
- Large arrays
- Closures
- Observers
- Third-party libraries
A small leak may not be noticeable after five minutes.
But after several hours, thousands of unused objects can accumulate.
2. React Effects Can Create Duplicate Work
React applications frequently use useEffect() for API calls, subscriptions, timers, and WebSocket connections.
Incorrect effect dependencies can cause an operation to be created repeatedly.
For example:
useEffect(() => {
  const interval = setInterval(() => {
    fetchMessages();
  }, 5000);

  return () => clearInterval(interval);
}, [messages]);
If messages changes frequently, the effect can repeatedly recreate the interval.
Poorly managed effects can result in:
1 timer
↓
5 timers
↓
20 timers
↓
100 timers
The application may still appear to work, but it is doing significantly more work than necessary.
When debugging a long-running React application, inspect every useEffect() and ask:
How many times can this effect run during the lifetime of the application?
Then ask:
What resources does it create, and are those resources cleaned up?
3. Timers Running Forever
PWAs often use timers for:
- API polling
- Session expiration
- Notifications
- WebSocket heartbeats
- Auto-refresh
- Countdown timers
- Background synchronization
- Analytics
- Clock updates
For example:
const interval = setInterval(() => {
  refreshData();
}, 30000);
This isn’t necessarily a problem.
The problem occurs when multiple timers are created or old timers aren’t cleared.
Always clean them up:
useEffect(() => {
  const interval = setInterval(() => {
    refreshData();
  }, 30000);

  return () => {
    clearInterval(interval);
  };
}, []);
The same principle applies to setTimeout() and animation loops using requestAnimationFrame().
Long-running applications need strict control over background work.
4. WebSocket Connections Can Multiply
Real-time PWAs commonly use WebSockets for chat, notifications, dashboards, tracking, and live updates.
A typical application may have one connection:
Browser
   ↓
WebSocket
   ↓
Server
But connection problems can occur when users navigate between screens, reconnect after network changes, or reopen components.
If the old connection isn’t closed properly, you may accidentally create:
Socket 1
Socket 2
Socket 3
Socket 4
Socket 5
Now one server event can be processed multiple times.
For example:
Server Event
     ↓
Socket 1 → UI update
Socket 2 → UI update
Socket 3 → UI update
Socket 4 → UI update
This creates duplicate processing and unnecessary rendering.
A production WebSocket implementation should include:
- Connection state management
- Controlled reconnection
- Heartbeats
- Error handling
- Cleanup
- Duplicate connection prevention
- Network recovery
- Visibility/focus handling
The important rule is:
One logical feature should not accidentally create unlimited connections.
5. Large DOM Trees
A PWA can become slower simply because too much UI remains mounted.
This is especially common in chat applications, activity feeds, logs, tables, and dashboards.
Imagine a chat application receiving 20,000 messages.
If all messages remain mounted:
Message 1
Message 2
Message 3
...
Message 20,000
The browser has to manage a very large DOM tree.
React also needs to manage the corresponding component tree.
As the number of elements grows, rendering and layout operations can become more expensive.
For large lists, virtualization can help.
Instead of rendering thousands of elements, the application renders only the items currently visible to the user.
Conceptually:
50,000 records
       ↓
Virtualized List
       ↓
Only visible records rendered
This can significantly improve scrolling and rendering performance.
6. Excessive React Re-Renders
Another common cause is unnecessary rendering.
Consider a dashboard containing:
- Charts
- Tables
- Notifications
- Statistics
- Activity feeds
- Maps
- User information
If one small state change causes the entire dashboard to re-render, the application may perform unnecessary work.
Common causes include:
- Frequently changing global state
- Large Context providers
- Unstable object references
- Unstable callback references
- Poor component boundaries
- Excessive state updates
Optimization tools such as:
React.memo()
useMemo()
useCallback()
can sometimes help.
However, developers shouldn’t add memoization everywhere without measuring the problem first.
The better approach is:
Measure → identify expensive rendering → optimize the specific bottleneck.
7. Unlimited In-Memory Data
Long-running applications often keep data in state.
For example:
const [logs, setLogs] = useState([]);Then every new event is appended:
setLogs(prev => [...prev, newLog]);If the application runs for 12 hours and receives thousands of events, that array continuously grows.
Instead of keeping everything in memory, use a limit:
setLogs(prev => {
  const updated = [...prev, newLog];

  return updated.slice(-1000);
});
Now only the latest 1,000 records remain in memory.
Older data can be stored on the server or in IndexedDB if it needs to be retained.
This approach is particularly useful for:
- Logs
- Chat messages
- Notifications
- Activity streams
- Monitoring data
- Real-time events
8. IndexedDB and Cache Storage Can Grow
PWAs commonly use IndexedDB and Cache Storage for offline functionality.
This is useful for storing:
- Messages
- Drafts
- Attachments
- API responses
- Images
- Offline requests
- Application data
But local storage should not be treated as unlimited.
If an application continuously stores data without cleanup, the local database and cache can grow significantly.
A good PWA should have a retention strategy.
For example:
Recent data
     ↓
Keep locally
     ↓
Old data
     ↓
Remove or archive
You should periodically remove:
- Expired cache entries
- Old drafts
- Temporary files
- Obsolete API responses
- Unused attachments
Cache versioning is also important when deploying new application versions.
9. Service Workers Aren’t the Same as Permanent Background Processes
A common misconception is:
“My PWA has a service worker, so the browser will keep it running forever.”
Service workers are event-driven. Browsers control when they are started and stopped.
The browser may suspend or terminate background work depending on system and browser conditions.
Similarly, a PWA can experience:
- Background throttling
- Network changes
- Device sleep
- Memory pressure
- Tab suspension
- Process termination
Therefore, applications shouldn’t assume that a connection or background process will always remain alive.
Instead, the application should be designed to recover.
10. Background Tabs Behave Differently
Browsers try to save battery and system resources.
When a PWA stays in the background for a long time, some browser activities can be throttled.
When the user returns to the application, the app should verify its state.
For example:
useEffect(() => {
  const handleVisibility = () => {
    if (document.visibilityState === "visible") {
      refreshData();
      checkConnection();
    }
  };

  document.addEventListener(
    "visibilitychange",
    handleVisibility
  );

  return () => {
    document.removeEventListener(
      "visibilitychange",
      handleVisibility
    );
  };
}, []);
This is especially useful for chat and dashboard applications.
Instead of assuming everything remained active, verify the connection and refresh stale data when necessary.
11. Heavy JavaScript Blocks the Main Thread
The browser’s main thread handles a large portion of UI work.
If your application performs expensive calculations on the main thread, the UI can become unresponsive.
For example:
for (let i = 0; i < 1000000000; i++) {
  // expensive operation
}
During a long-running operation like this, the browser has limited opportunity to respond to user interactions.
For CPU-heavy work, Web Workers can move computation away from the main UI thread.
The architecture becomes:
Main Thread
     ↓
Web Worker
     ↓
Heavy Processing
     ↓
Result
     ↓
Main Thread
This is useful for:
- Large file processing
- Encryption
- Image processing
- Complex calculations
- Large-data parsing
- Search indexing
12. Third-Party Scripts Can Cause Problems
Sometimes the application code isn’t responsible for the freeze.
Third-party libraries can also consume significant resources.
Examples include:
- Analytics
- Maps
- Chat widgets
- Monitoring tools
- Payment SDKs
- Advertising systems
- Social integrations
A third-party script may continuously create DOM nodes, timers, network requests, or event listeners.
When debugging, temporarily disable external integrations and compare performance.
If the application becomes significantly more stable, investigate the third-party dependency.
How to Diagnose a Frozen PWA
Don’t immediately assume the service worker is responsible.
Start with browser developer tools.
Check Memory
Look for:
- JavaScript heap size
- Detached DOM nodes
- Large objects
- Event listeners
- Increasing memory usage
Take a memory snapshot when the application starts and another after several hours.
For example:
Start       → 40 MB
1 hour      → 70 MB
3 hours     → 150 MB
6 hours     → 350 MB
If memory continually increases without returning to a stable level, investigate leaks.
Check Performance
Look for:
- Long JavaScript tasksMore Info
- Related Blog
- Excessive rendering
- Layout operations
- Garbage collection
- Expensive functions
Check Network
Look for:
- Duplicate requests
- Excessive polling
- Multiple WebSockets
- Failed requests
- Requests that never complete
Check Application Storage
Inspect:
- IndexedDB
- Cache Storage
- Local Storage
- Service Workers
Determine whether local data grows indefinitely.
How to Build a Long-Lived PWA
A reliable PWA should be designed around resource lifecycle management.
For every resource, ask:
When is it created?
And:
When is it destroyed?
| Resource | Created | Cleanup |
|---|---|---|
| Event Listener | Component mount | Component unmount |
| Timer | Feature starts | Feature ends |
| WebSocket | Connection starts | Connection closes |
| Subscription | Subscribe | Unsubscribe |
| Worker | Worker created | Worker terminated |
| DOM | Component render | Component removal |
| Cache | Cache write | Expiration/cleanup |
| IndexedDB data | Data stored | Retention policy |
If you cannot explain when a resource is destroyed, it deserves investigation.
Long-Session Testing Is Essential
One of the biggest mistakes developers make is testing PWAs only for short periods.
A five-minute test may not reveal a problem that appears after six hours.
For long-running applications, test scenarios such as:
Open PWA
   ↓
Use continuously
   ↓
Navigate between screens
   ↓
Open and close modals
   ↓
Send and receive messages
   ↓
Switch browser tabs
   ↓
Disconnect network
   ↓
Reconnect network
   ↓
Put device to sleep
   ↓
Return to application
   ↓
Continue using
   ↓
Monitor for 6–12 hours
Track:
- Memory
- CPU
- DOM size
- WebSocket count
- API requests
- IndexedDB size
- Cache size
- Errors
- Rendering performance
This kind of testing can reveal problems that normal functional testing misses.
Final Thoughts
A PWA freezing after several hours is rarely caused by a single issue.
More commonly, multiple small problems accumulate:
Memory leaks + timers + WebSockets + large state + DOM growth + unnecessary rendering + storage growth = long-session performance problems.
The most important lesson is to think about resource lifetime.
Every listener should have cleanup.
Every timer should have cleanup.
Every WebSocket should have a controlled lifecycle.
Every subscription should eventually be removed.
Every large dataset should have a retention strategy.
Every cache should have an expiration or versioning strategy.
And every long-running PWA should be tested under realistic conditions.
A PWA isn’t truly production-ready simply because it loads quickly.
It should remain responsive, stable, and recoverable after hours of continuous use.
The goal isn’t to make the browser run your application forever without interruption.
The goal is to build an application that can handle long sessions, recover from interruptions, release resources correctly, and remain responsive throughout the user’s entire session.
Fast at startup is good.
Fast after 8 hours is better.
Fast, stable, and recoverable after 12 hours is production-ready.